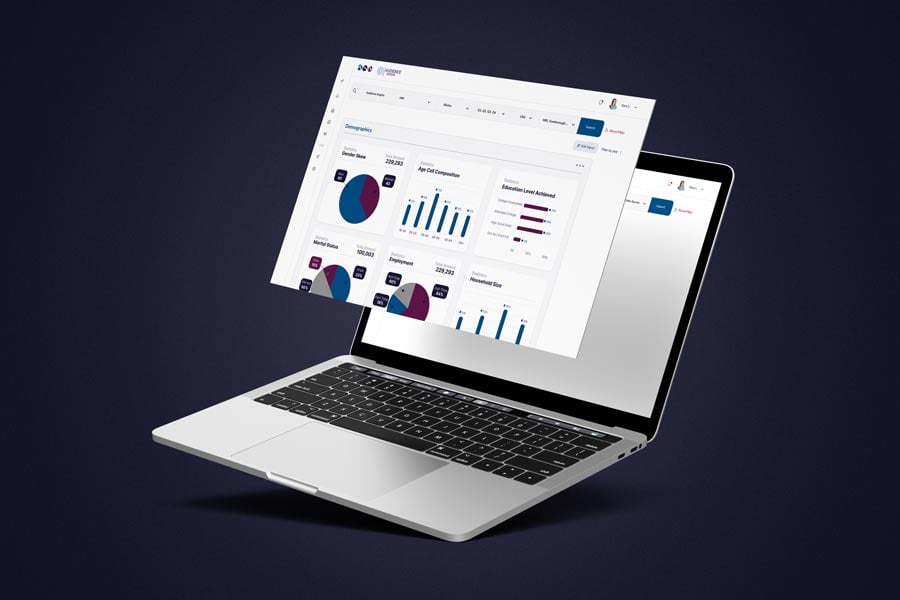
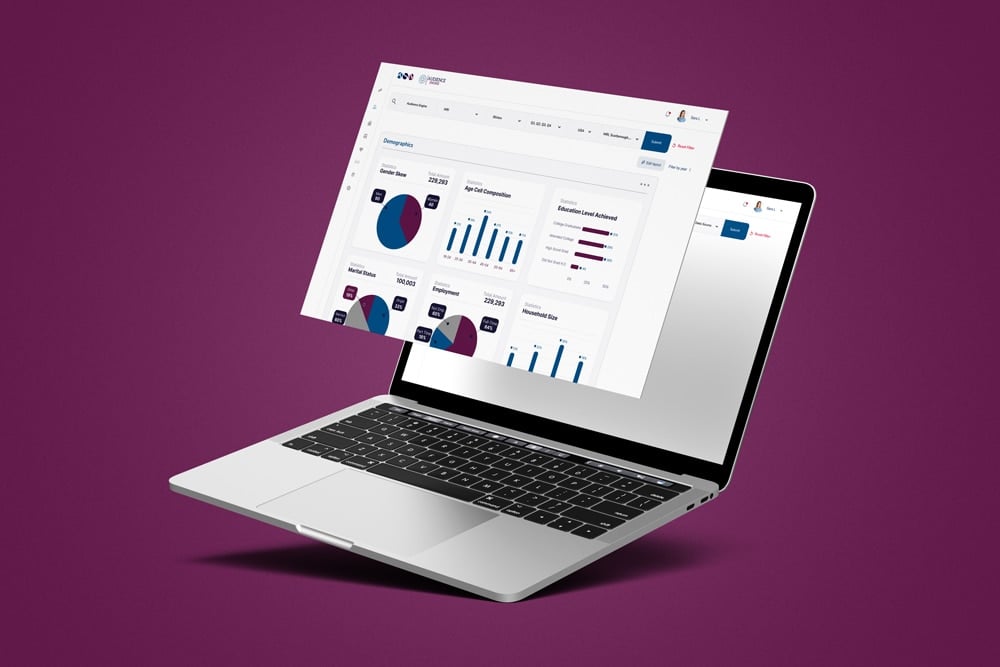
A SaaS analytics platform that makes managing and engaging an audience feel effortless.
End-to-endConcept to launch
FullUX/UI ownership
FigmaDesign toolset
SaaSPlatform type
The Challenge
Businesses managing large, active audiences were juggling engagement and analytics tasks across tools that were never designed to work together. The result was a fragmented experience where segmenting audiences, tracking engagement, and reading performance data each demanded its own mental model. Teams lost time to context-switching and struggled to turn raw audience data into confident decisions.
Audience Engine needed to consolidate that scattered workflow into one SaaS platform that felt intuitive from the first session, without sacrificing the depth that power users depend on. The design challenge was to make sophisticated audience management and analytics approachable, keep the interface scalable as feature scope grew, and ground every layout decision in evidence rather than assumption.
Approach
Framed the problem through researchOpened with surveys and stakeholder interviews to understand how teams actually manage and segment their audiences today, mapping the real workflows and friction points before a single frame was drawn.
Structured the information architectureTranslated research into a clear IA for audience management and analytics, organizing segmentation, engagement, and reporting tasks into a logical hierarchy that reduced cognitive load across the platform.
Wireframed and prototyped in FigmaBuilt low-fidelity wireframes and interactive prototypes to pressure-test flows early, iterating on layout and navigation before committing to visual detail.
Validated with usability testing and A/B testsRan usability sessions and A/B comparisons on key screens, using observed behavior to resolve competing layout and interaction decisions rather than relying on opinion.
Delivered high-fidelity, scalable UICrafted the high-fidelity interface and a reusable component structure in Figma, then partnered cross-functionally with engineering to carry the design intent through to a shippable, scalable build.
Key Features
Audience management dashboard
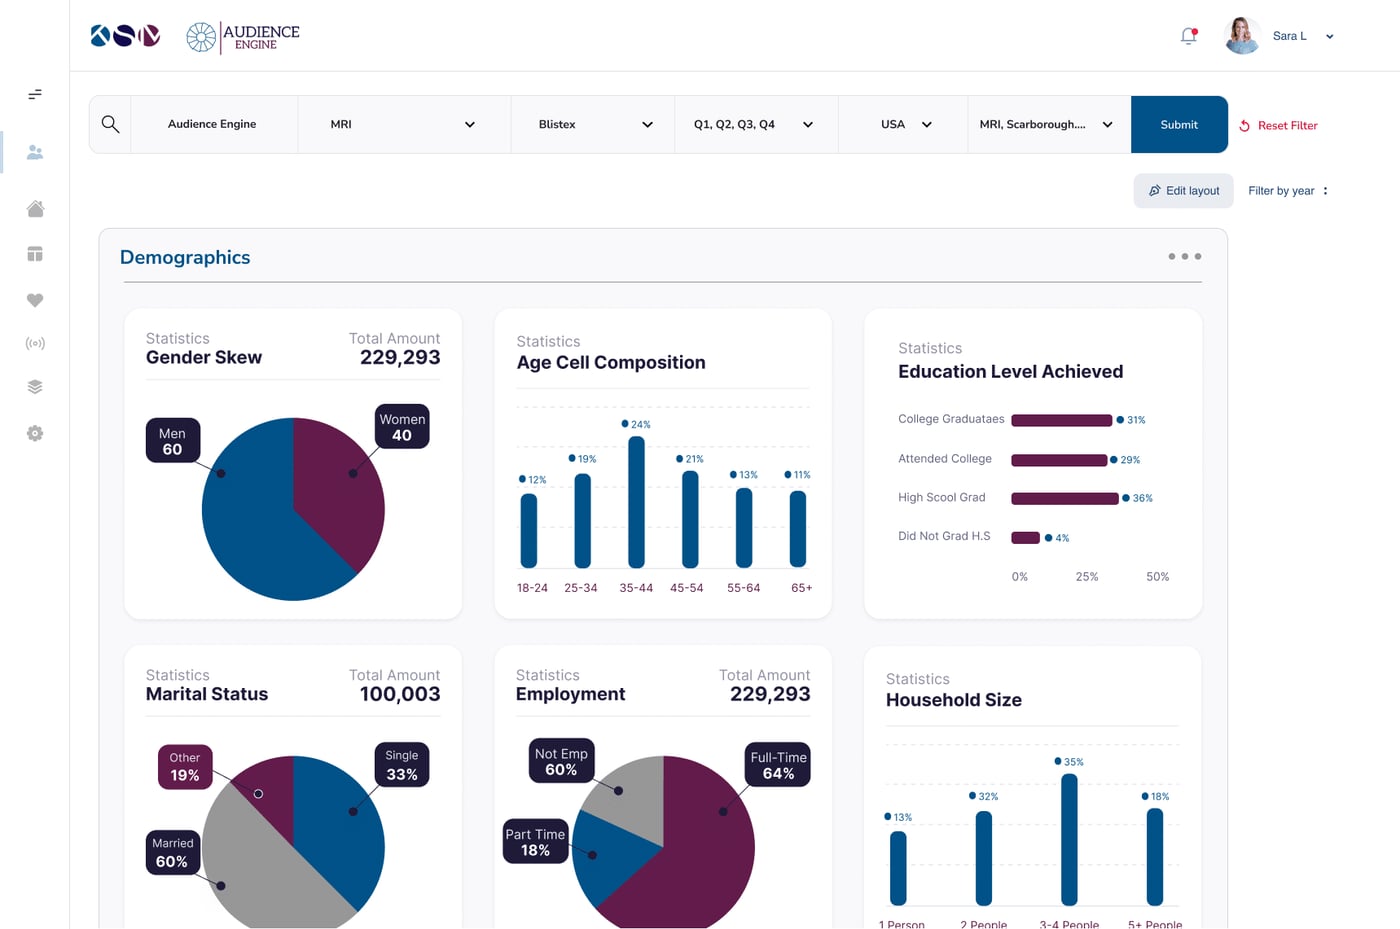
A central main screen that brings audience segments, engagement, and key metrics into a single, scannable view so teams orient themselves in seconds.
Analytics and reporting
Clear data visualization surfaces audience performance and engagement trends, turning dense metrics into something a user can read at a glance.
Intuitive navigation structure
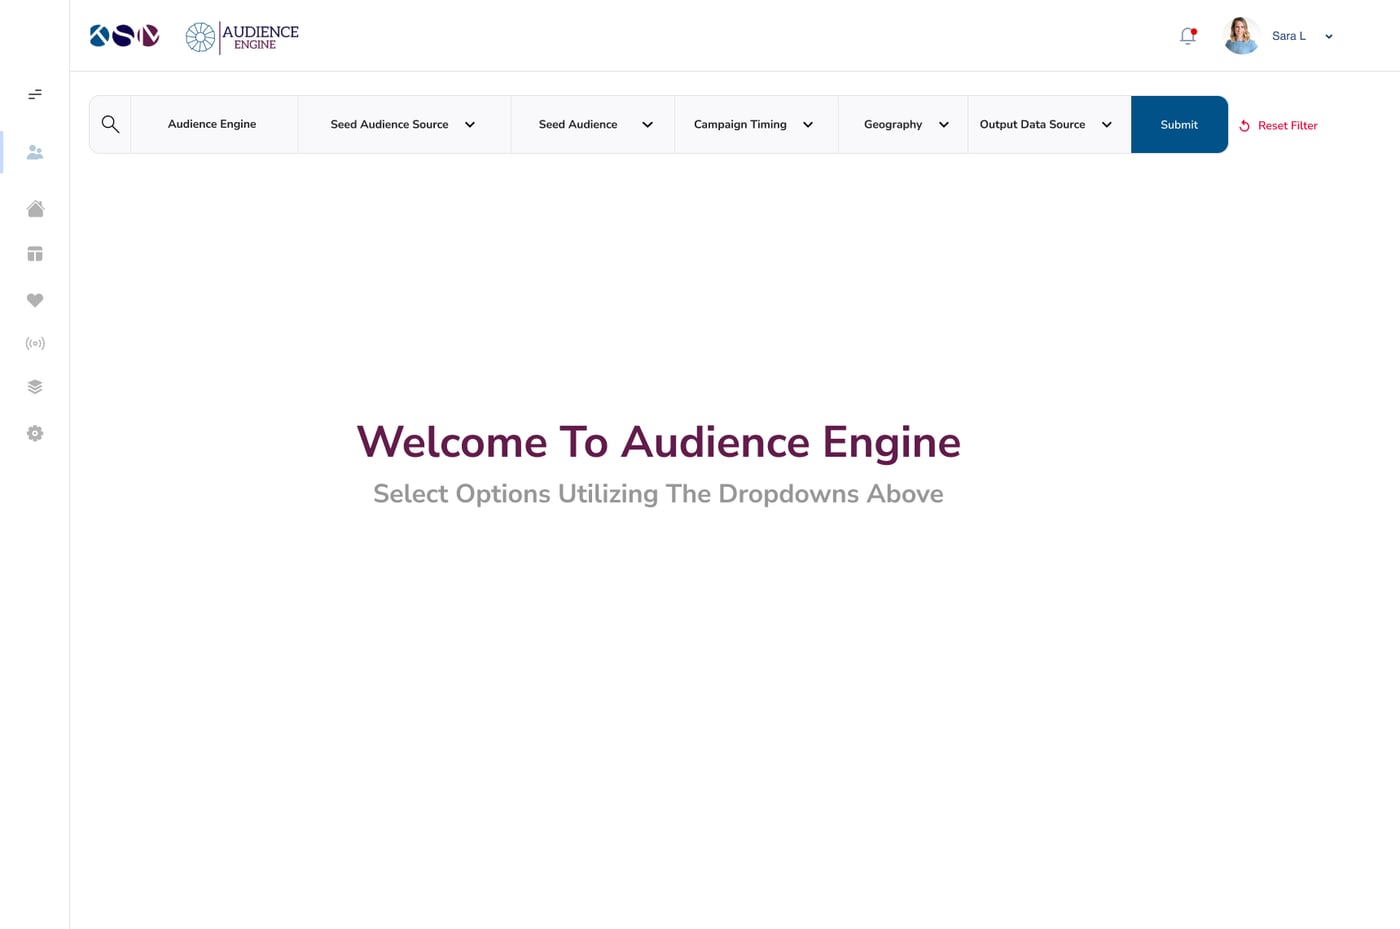
An information architecture built from research organizes segmentation, engagement, and reporting into a predictable hierarchy that lowers cognitive load.
Reusable component system
A consistent set of Figma components and patterns keeps the interface coherent across screens and scalable as the platform grows.
High-fidelity interface design
A polished, user-friendly visual layer applies consistent typography, spacing, and hierarchy to make complex tasks feel calm and controlled.
Responsive layout
Layouts built and reviewed in a desktop context are designed to hold their structure and legibility across the screen sizes teams work on.
Sophisticated data earns trust only when the interface makes it feel effortless, every layout decision here was tested against real behavior, not opinion.
Chris Cooper, design rationale
Results
Delivered a complete SaaS platform from concept to launch, spanning wireframes, interactive prototypes, and a high-fidelity interface.
Produced a scalable, reusable component system in Figma that keeps the UI consistent as feature scope expands.
Earned positive stakeholder feedback for an intuitive, user-friendly design that made audience management tasks feel approachable.
Streamlined the audience-management workflow, improving the efficiency with which teams segment, engage, and report on their audience.
Strategy
User research through surveys and stakeholder interviews
Workflow and pain-point mapping for audience management
A/B testing to resolve key design decisions
Cross-functional collaboration with engineering and stakeholders
Design
Information architecture for segmentation, engagement, and reporting
Low-fidelity wireframes and interactive prototypes
High-fidelity, user-friendly interface design
Reusable component system for scalability
Data visualization for analytics and engagement metrics